This topic, MASS SPECTROMETER is quite difficult to visualize because its involved many stage. Therefore we come out with this blog to help the students to understand better. Each process of mass spectrometer is illustrated by the photo diagram captured from the International Baccalaureate animated chemistry courseware. In addition, the other link related to this topic also provided.
Tuesday, 5 June 2012
MASS SPECTROMETER
Diagram above shows the instrument of Mass Spectrometer. The main uses of the Mass Spectrometer is to measured the masses of the different isotopes and their relative abundance.
For more information about this Mass Spectrometer, you can view details from MASS SPECTROMETER website. This page describes how a mass spectrum is produced using a mass spectrometer.
Monday, 4 June 2012
THE OPERATION OF MASS SPECTROMETER
- The mass spectrometer has five basic operations:
- The diagram below shows the 5 main components in mass spectrometer
- The 5 stages are:
Stage 1: Vapourization
The diagram above shows a vapourized sample is injected into the instrument. This allows the individual atoms of the element to be analysed.
Stage 2: Ionization
The diagram above shows the atoms are hit with high-energy electrons which knock out electrons, thus producing positively charged ions:
X(g) + e- → X+(g) + 2e-
In practice, the instrument can be set up to produce only singly charged positive ions.
Stage 3: Acceleration
The diagram above shows the positive ions are attracted to negatively charged plates. They are accelerated by an electric field and passed through a hole in the plate.
Stage 4: Deflection
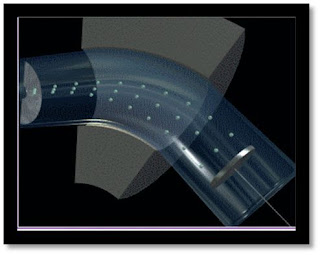
The diagram above shows the accelerated positive ions are deflected by magnetic field placed at right angles to their path. The amount of deflection is proportional to the charge/mass ratio. Ions with smaller mass are deflected more than heavier ions. Ions with higher charges are deflected more as they interact more effectively with the magnetic field.
Stage 5: Detection
The diagram above shows positive ions of a particular mass/ charge ratio are detected and a signal sent to a recorder. The strength of the signal is a measure of the number of ions with that charge/mass ratio that are detected.International Baccalaureate animated chemistry courseware
**ALL THE PHOTO DIAGRAM ARE CAPTURED FROM INTERNATIONAL BACCALAUREATE ANIMATED CHEMISTRY COURSEWARE**
Subscribe to:
Comments (Atom)


